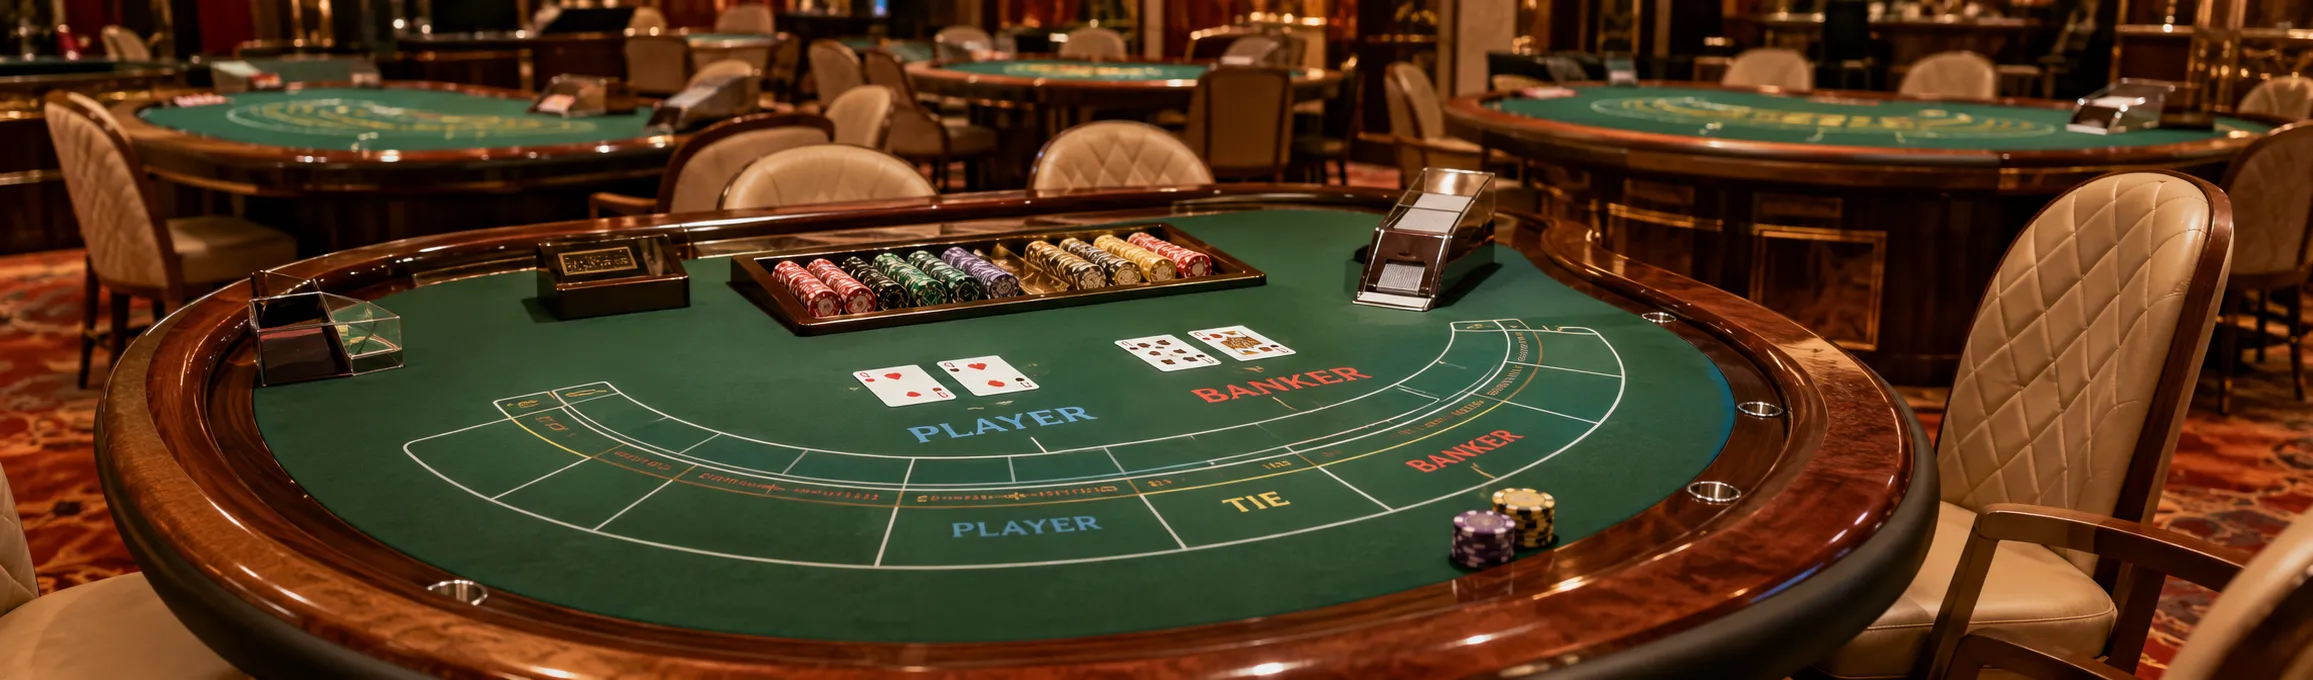
A busy casino table may look successful from the gaming floor. Every seat is occupied, chips are moving, the dealer is active and players appear engaged. From an operational perspective, however, a full table is not automatically an efficient table.
The table may remain open for eight hours but spend a significant part of that time waiting for players, resolving disputes, confirming wagers, changing cards, checking equipment or completing slow settlements. It may attract high betting volume but require more employees, more supervisory attention and longer reconciliation work than another table producing steadier activity with fewer interruptions.
This is why casino operators need to distinguish table popularity, short-term table win and real table productivity.
A modern management approach examines how effectively a table uses operating time, staff, equipment and floor space. The objective is not simply to determine whether a table won or lost during one shift. It is to understand how the table operated and whether the resources assigned to it were used efficiently.
Table win is an important financial result, but it is not a complete measurement of operating efficiency.
A table may report a strong win during one shift because a small number of high-value wagers produced favorable results for the property. Another table may record a weaker result even though it completed more rounds, maintained steady player participation and operated with fewer interruptions.
Short-term game outcomes can therefore distort comparisons between tables.
Consider two baccarat tables:
Table A attracts several high-value wagers and records a strong win, but remains inactive for long periods between player sessions.
Table B operates at a lower average wager level but maintains consistent activity throughout the shift and completes substantially more valid rounds.
Looking only at table win would make Table A appear more productive. Looking at active operating time, game pace, staffing and table utilization may produce a different conclusion.
Casino management therefore needs to separate financial outcomes from operational performance.
Real table productivity describes how effectively a gaming table converts available operating time and assigned resources into valid gaming activity.
It should not be reduced to one number. Operators normally need to examine several related measures together.
| Measurement | What It Shows |
|---|---|
| Scheduled operating time | How long the table was planned to remain available |
| Active gaming time | How much of that period contained actual game activity |
| Idle time | Time spent open without an active game |
| Rounds completed | Number of completed and valid game rounds |
| Average round duration | How quickly the full game cycle was completed |
| Seat utilization | How many available player positions were actively used |
| Average wager level | Typical betting value during active play |
| Settlement time | Time required to collect losing wagers and complete payouts |
| Exception frequency | Number of disputes, recognition errors or settlement reviews |
| Staffing requirement | Dealers, supervisors and support resources assigned to the table |
These measurements answer different questions.
A high round count may indicate efficient game flow, but it may be less valuable if average participation is extremely low. A high average wager may appear commercially attractive, but repeated settlement errors or long inactive periods may reduce the table’s wider operating value.
The useful result comes from reading the measurements together.
One of the most common mistakes in table analysis is treating scheduled opening time as productive operating time.
A table opened at 6:00 p.m. and closed at 2:00 a.m. was technically available for eight hours. It was not necessarily active for eight hours.
During that period, the table may have experienced:
periods without players;
delays before betting began;
card or equipment changes;
shift handovers;
supervisor reviews;
disputed results;
extended collection and payout procedures;
temporary system or communication interruptions.
Assume an illustrative table was open for 480 minutes but recorded only 330 minutes of active gaming. Its effective active-time utilization would be 68.75%, not 100%.
That difference matters because the operator paid for the table space, dealer time, supervisory coverage and supporting equipment throughout the entire eight-hour period.
A connected management system can record when a table is open, when betting begins, when a round is completed and when operations are paused. This provides a more realistic picture than relying on the opening and closing timestamps alone.
Seat occupancy is useful, but it can also be misleading.
A baccarat or blackjack table may be full while completing relatively few rounds because the operating cycle is slow. The delay may occur during wager confirmation, card handling, result verification, chip collection or payout.
Possible causes include:
players repeatedly changing wagers before betting closes;
manual chip counting at several positions;
slow confirmation of side bets;
complicated commission calculations;
frequent disputes over wagers or results;
equipment that requires repeated manual correction;
unclear responsibilities between dealers and supervisors.
Another table with fewer players may complete more rounds because its operating process is stable and predictable.
The objective is not to force every table to operate at maximum speed. Excessive speed can create service, accuracy and control problems. The objective is to identify where unnecessary delay occurs and whether it can be corrected without weakening the player experience or internal controls.
Casino operators should not apply one universal benchmark to baccarat, blackjack, roulette, Niu Niu and other games.
The structure of each game affects round duration, staffing, player interaction and settlement complexity.
Baccarat generally follows a relatively structured operating sequence:
Betting opens.
Players place wagers.
Betting closes.
Cards are dealt.
The result is confirmed.
Losing wagers are collected.
Winning wagers are paid.
This makes it possible to examine the time used by each stage.
For example, management may compare how long different baccarat tables spend in the betting phase, dealing phase and settlement phase. If one table repeatedly requires longer settlement time, the cause may involve chip recognition, commission handling, side-bet complexity or dealer workflow.
A baccarat table should therefore be evaluated using more than total rounds. The operator also needs to consider player participation, average wager, settlement accuracy and the number of interrupted rounds.
Blackjack involves more individual player decisions.
Players may hit, stand, double down or split. One original round can therefore produce several hands with different wagers and results.
A longer blackjack round is not automatically inefficient. The table may simply have more active positions or more complex player decisions.
Useful blackjack measurements include:
occupied player positions;
hands completed per operating hour;
number of split and double-down actions;
settlement accuracy;
dealer decision-processing time;
inactive time between rounds.
Comparing blackjack directly with baccarat based only on rounds per hour would produce a misleading result.
Roulette has a different time structure.
The table must allow players to place bets across numerous positions, close betting, confirm the winning number and complete settlements across different payout ratios.
A roulette table may require more settlement time even when the game result itself is produced quickly.
Productivity analysis should therefore examine betting-window duration, number of active betting positions, settlement time, disputed wagers and the interval before the next spin.
Niu Niu and other regional games may use operator-specific rules, betting areas, commissions and player structures.
The same game can also be managed differently between venues or markets.
A useful system must allow the operator to configure:
table positions;
game stages;
payout rules;
commission logic;
player or agent relationships;
reporting fields;
permitted chip categories.
This is why productivity management requires configurable game logic rather than one fixed template applied to every table.
Traditional table controls remain necessary.
For example, Nevada’s table-game internal-control procedures require table chip, token and coin inventories to be counted and recorded at the end of a shift, together with controlled fill and credit procedures. These requirements support asset accountability and financial reconciliation.
However, an end-of-shift inventory record does not explain how efficiently the table operated during the shift.
A closing count may confirm that the table inventory is correct while revealing nothing about:
how long the table remained inactive;
how many rounds were completed;
where operational delays occurred;
whether staffing matched player demand;
how often settlements required supervisor review;
whether another table could have handled the same activity.
Internal control and productivity analysis are therefore related but different.
Control records answer whether assets and transactions were properly accounted for. Productivity records help management understand how effectively the table, equipment and staff were used.
A complete casino management environment should support both.
A management system becomes useful when it separates the table process into measurable operating stages.
For a baccarat table, the system may record when betting opens, when wagers are confirmed, when cards are dealt, when the result is established and when settlement is completed.
If one table consistently produces longer rounds, management can examine which stage accounts for the difference.
Long betting periods may be caused by late wagers, unclear betting limits, repeated chip changes or slow recognition of chips placed in the betting areas.
Repeated interruptions may indicate electronic-shoe communication problems, recognition errors, damaged cards or an operating procedure that requires unnecessary manual confirmation.
A slow settlement phase may involve complex side bets, manual commission calculations, chip-denomination confusion or disagreements between the visible table position and the system record.
A table may complete each round efficiently but remain inactive for long intervals while waiting for players or a dealer instruction.
This is why the average total round duration should be broken into separate stages rather than treated as one unexplained number.
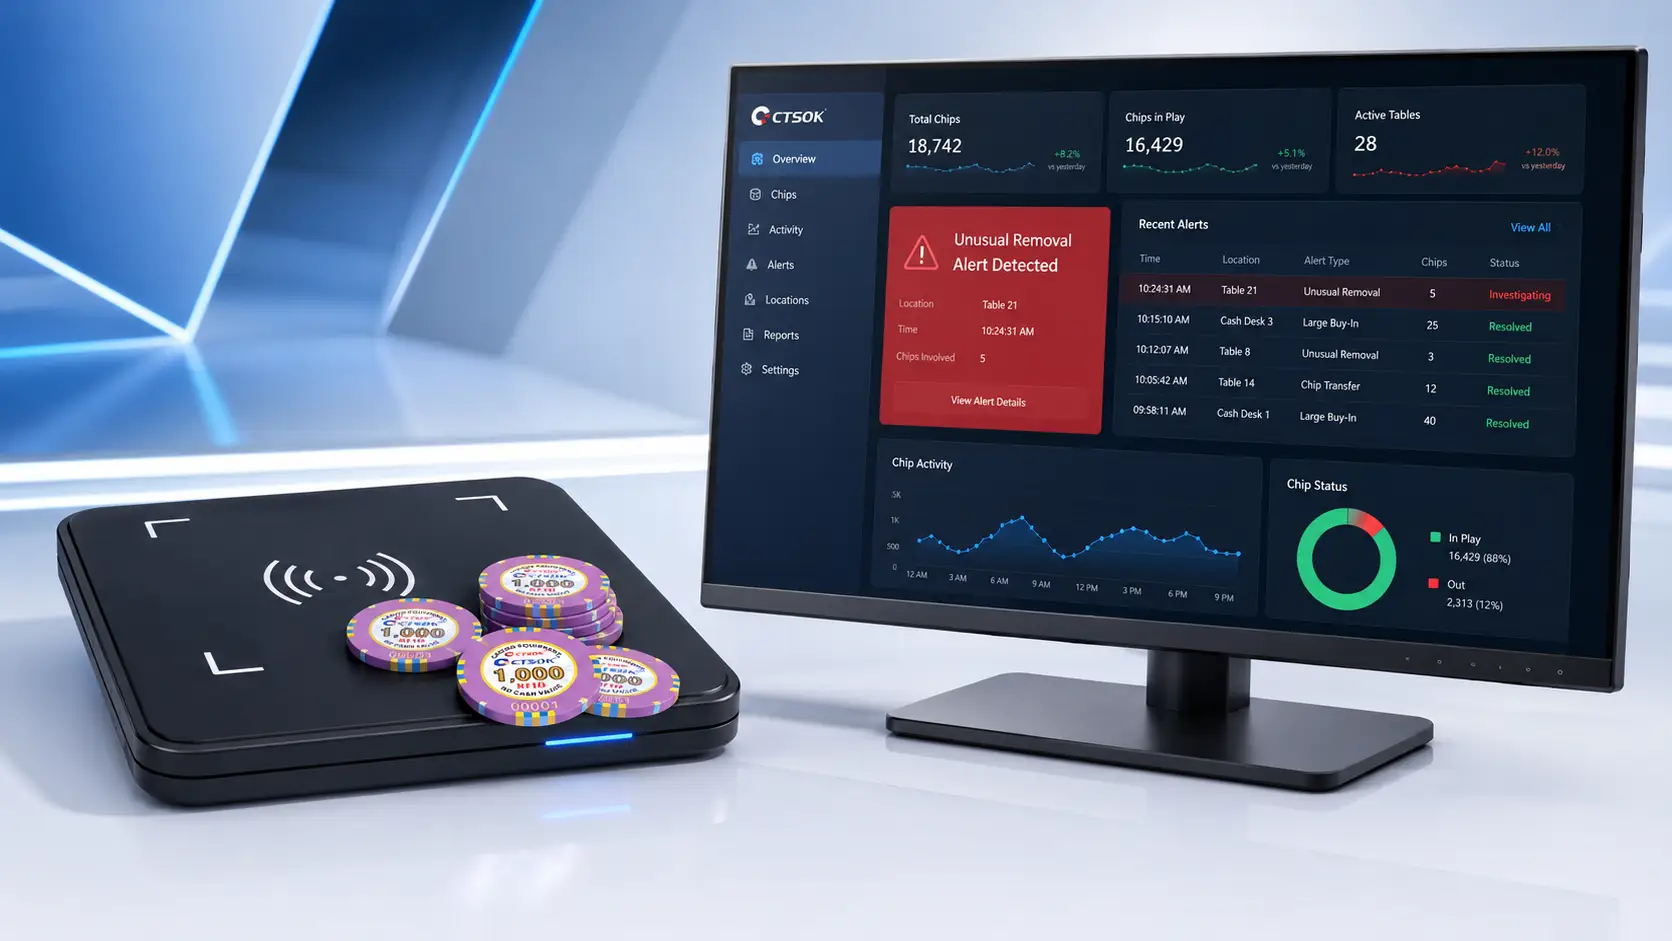
RFID technology can contribute to table-productivity analysis by providing structured chip and wager information at compatible reading points.
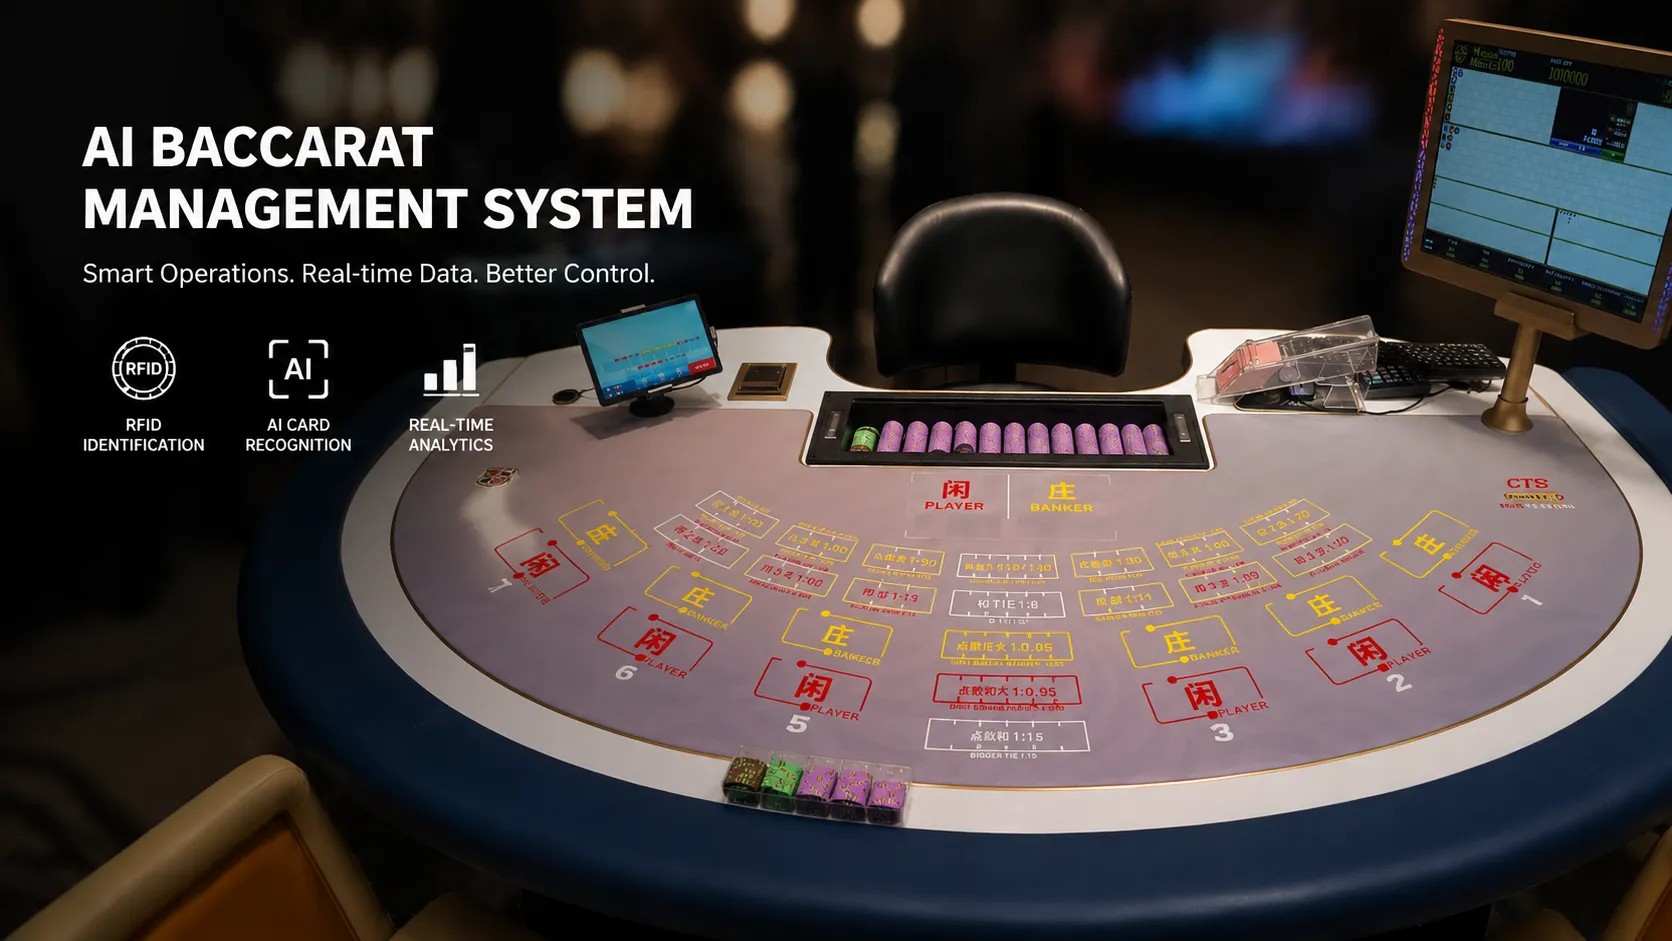
When RFID chips are associated with defined betting zones, the system can record when wagers are present and when betting activity changes. A connected chip tray can provide information about table inventory and settlement movement. An electronic card shoe can supply dealing and result data, while a dealer terminal can record operational confirmations and table status.
The technology does not make the management decision. It provides data that would otherwise depend heavily on manual observation.
CTSOK describes its connected table architecture as combining RFID chip identification, dealer terminals, chip trays, card shoes, table displays and centralized management tools. The platform is designed to connect table activity with operational review and reporting rather than treating each device as an isolated product.
For operators evaluating this type of deployment, the critical question is not simply whether the table contains RFID readers. It is whether the resulting data can be associated with specific operating stages and reviewed through the wider casino management system.
Opening more tables is not always the best response to a busy gaming floor.
If players are spread across several partially occupied tables, the property may be assigning more dealers and supervisors than the activity requires. Consolidating players into fewer tables may improve seat utilization while reducing unnecessary staffing.
The opposite can also occur. If active tables remain consistently full, waiting increases and players cannot find suitable positions, additional capacity may be justified.
A management platform can support this decision by showing:
active and inactive tables;
effective gaming time;
seat utilization by time period;
game demand across different areas;
average wager and chip activity;
operating interruptions;
available dealer and supervisor resources.
The system should not automatically close a table because one indicator falls below a threshold. VIP activity, player relationships, reserved positions, regulatory requirements and service strategy may justify keeping a low-volume table open.
Data provides evidence for the decision. It does not remove the need for management judgment.
Player count is only one part of staffing analysis.
Two tables with the same number of players may require different levels of support.
A standard baccarat table with stable procedures may operate efficiently with its normal dealer and floor coverage. Another table with high-value wagers, complex side bets or frequent disputes may require closer supervision.
Management should consider:
active table count;
game type and complexity;
number of active player positions;
average wager level;
exception and dispute frequency;
planned breaks and shift changes;
equipment condition;
VIP or agent-management requirements.
Historical data can also reveal recurring patterns.
If baccarat demand consistently rises during a specific evening period, the operator can prepare additional tables and dealers before the floor becomes congested. If several tables remain underused during another period, staffing can be adjusted without waiting for supervisors to identify the pattern manually each day.
It may be tempting to combine every measurement into one table-efficiency score.
This can simplify reporting, but it can also hide important operating differences.
A table may receive a low score because its rounds are slow, even though it serves high-value VIP players and supports a deliberate service model. Another table may receive a strong score because it completes many rounds, while repeated settlement corrections create control risk.
Management dashboards should therefore allow users to review the underlying measurements rather than showing only one ranking.
A practical analysis normally combines three views:
This includes average wager, gaming activity and the financial result over an appropriate period.
This includes active time, round duration, seat utilization, downtime and staffing.
This includes settlement exceptions, recognition errors, inventory differences and supervisor interventions.
A table should be assessed in the context of its purpose, game type and operating area.
Data collection alone does not guarantee useful analysis.
Several mistakes can produce misleading conclusions.
Comparing unlike games: Baccarat, blackjack and roulette should not share identical round-speed targets.
Using short-term win as the main score: A small number of large outcomes can distort one shift’s financial result.
Ignoring inactive periods: Scheduled opening time can overstate actual utilization.
Rewarding speed without checking accuracy: More rounds are not valuable when errors and disputes increase.
Treating every exception as staff misconduct: Equipment configuration and workflow problems can also create abnormal records.
Using data without operational context: VIP service, reserved tables and local operating requirements may justify apparently low utilization.
The system should help management investigate these differences rather than produce an automatic judgment based on one metric.
A useful review can be conducted at the end of each shift, day or selected operating period.
Management can begin with the overall floor view and identify tables with unusually high idle time, low seat utilization, slow settlement or frequent exceptions.
The next step is to compare the table with similar tables running the same game and operating under similar conditions. If the difference remains significant, the operator can examine the underlying stage data.
The final review should identify whether the cause relates to:
player demand;
staffing;
table procedure;
equipment;
game configuration;
settlement complexity;
physical table layout.
The result may lead to a change in table schedule, dealer assignment, game type, equipment configuration or staff training.
This makes productivity analysis a management process, not merely a dashboard display.
A professional gaming table is more than a piece of furniture. Its layout, chip tray, dealer area, card equipment, displays and RFID infrastructure all affect the operating process.
CTSOK’s range of commercial casino gaming tables includes baccarat, blackjack, roulette, Niu Niu and other configurations, with options for connected equipment and management-system integration. Its product architecture places the physical table within a wider ecosystem that includes RFID identification, dealer workflows, card data and centralized reporting.
The value of this integration is not that every table becomes identical.
It allows each table to produce structured information according to its actual game and operating rules. Management can then compare activity across the floor without losing the differences between individual games, player segments and service models.
Casino table productivity should not be defined as “the table that wins the most” or “the table with the most players.”
A productive table is one that uses operating time, equipment and personnel effectively while maintaining accurate procedures, acceptable service and reliable financial control.
That definition requires several measurements rather than one convenient number.
By connecting table status, chip activity, game stages, settlement records and staffing information, a casino management system can help operators understand:
when a table is genuinely active;
where avoidable delays occur;
which games require additional capacity;
when tables can be consolidated;
how staffing should follow demand;
whether faster operation is also accurate operation.
A full table may be commercially valuable, but occupancy alone does not explain its efficiency.
The more useful question is whether the table is producing controlled, consistent and measurable gaming activity with an appropriate level of resources. That is the point at which casino table data becomes operational management rather than simple monitoring.
Interested in our products? Click the button below to book a demo or get more information